Power BI Data Scraping Services for Advanced Business Insights
We seamlessly blend powerful web data extraction with immersive Power BI analytics, empowering businesses to transform information into actionable intelligence. Whether you’re scraping e-commerce pricing, social media sentiment, job portal trends, airline rates, or financial benchmarks, we clean, structure, and enrich your data in Excel, XML, Access, or SQL formats. Our team then designs dynamic Power BI dashboards—ranging from budget tracking to performance comparisons—so decision-makers can explore KPIs in real time and uncover insights that drive growth klicknetics.com.
-
Insight-Driven Visual Dashboard
-
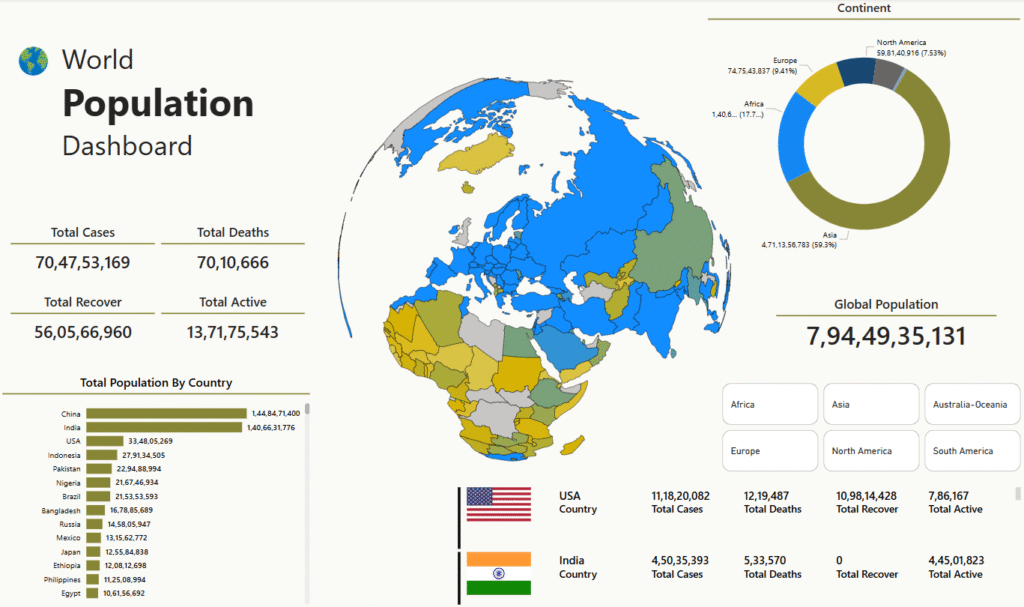
A Global Data Overview.
-
Analyzing world population in a Power BI report involves visualizing demographic data, comparing population metrics across countries and continents, and integrating global health statistics for deeper insights.
🧠 Quick Comparative Insights
🔗 Multi-Level Filters
🛰️ Geospatial Intelligence
📉 Interactive Visualizations
-
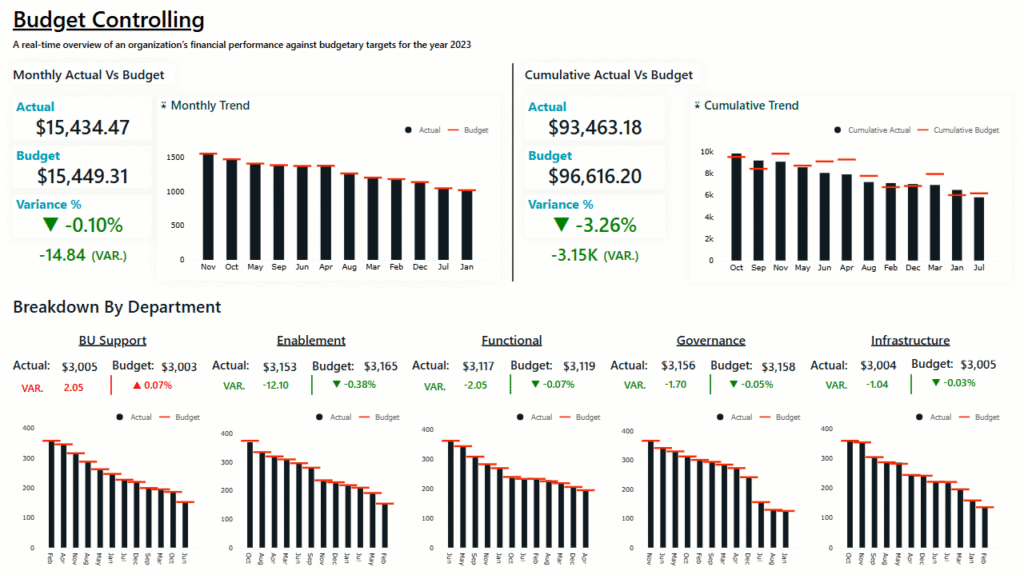
Performance Comparison Dashboard
-
Track and analyze budget performance with clear, data-driven insights in Power BI.
-
Budget tracking in Power BI helps organizations easily see their financial performance, spot differences between actual and planned spending, and stay on top of their finances with clear comparisons across departments and over time.
💵 Real-Time Budget Monitoring
📊 Variance Highlights
🏢 Department-Level Drilldown
📈 Trend Tracking Over Time
🎯 Performance Insights
-
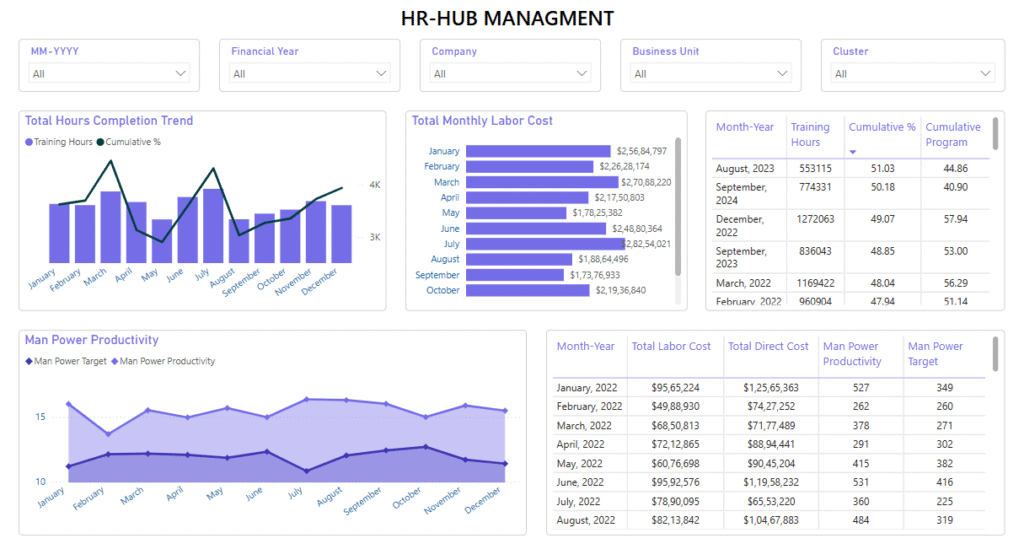
Organisational Insights Dashboard
-
A centralized dashboard to monitor workforce performance, training, and labor costs in real time.
-
Streamline workforce analytics and HR efficiency with dynamic, real-time visuals in Power BI.
This dashboard empowers organisations to track manpower productivity, monitor training hours, and control labour costs, providing a holistic view of HR performance across departments.
🧭 Cumulative Insights
💰 Cost Monitoring
📊 Training Insights
📈 Productivity Tracking
📅 Multi-Metric Comparison
-
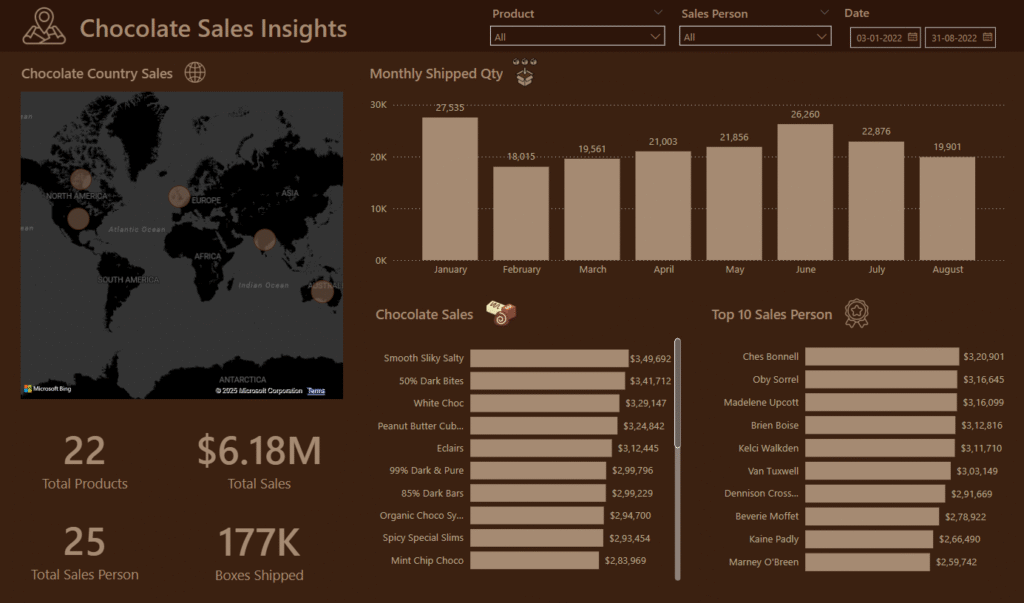
Sales Dashboard
-
Chocolate Sales Insights Dashboard.
-
Visualise chocolate product sales across regions and months using dynamic, data-rich charts in Power BI. This dashboard enables companies to monitor product popularity, monthly shipping quantities, and sales team contributions, offering a complete view of sales efficiency and market reach.
🍫 Top-Selling Product
🌟 Top Sales Performer
📦 Peak Shipping Month
🌍 Global Reach
📈 Total Revenue
👥 Sales Force Strength
Conclusion
Unlock the full potential of your data with KlickNetics’ end-to-end Power BI data scraping services—from robust extraction of external and internal sources to tailored dashboards that tell your story at a glance. By marrying intuitive web scraping with interactive visualizations, we help you detect trends, optimize strategies, and accelerate data-driven decision-making across industries. Connect with us today to elevate your analytics journey and uncover the narratives hidden in your data.